Candlestick Trading Systems – Stock Reading With Candlestick Patterns – TC2000 PCFs – TradeOn.com

Candlestick Trading Systems

What will be presented here is a collection of trading systems that use the various Candlestick Patterns. These systems are undergoing constant updating and improvements. If you see a way to improve on one of these systems please feel free to post it at the YaHoo TC2000 board. This is not a tutorial on Candlesticks, so if you want to get a feel for what candles can do for you, buy a Good Book, Candlestick Trading Secrets – You need this one.

Below is a window of the Tab settings used. These are just for reference. Use what ever you are familiar with for tab settings.

In order for you to see the actual Candle pattern the date line on the graphs has been moved one day to the left. The actual signal day is the next day to the right of the date line. I have included 2 graphs for each PCF in an a temp to show you a past signal and a present signal.

Hammer: (DownTrend reversal -bullish-)

PCF:

(C > O) AND (C = H) AND (O – L) >= (2 * (C – O)) AND (MINL10 = L) AND
(AVGC5.6 > (1.1 * AVGC5.1)) AND (AVGV10.1 > 250)

Engulfing: (DownTrend reversal -bullish-)

PCF:

((MINL10 = L1) OR (MINL10 = L)) AND (C1 < O1) AND (C > O1) AND (O < C1) AND ((2
* (O1 – C1)) < C – O) AND (AVGC5.6 > (1.1 * AVGC5.1))) AND (AVGV10.1 > 250)

Hangman: (UpTrend reversal -bearish-)

PCF:

(AVGC5.1 > (1.1 * AVGC5.6)) AND (C < O) AND (O = H) AND (MAXH10 = H) AND (C – L) >=
(2 * (O – C)) AND (AVGV10.1 > 250)

Engulfing: (UpTrend reversal -bearish-)

PCF:

(AVGC5.1 > (1.1 * AVGC5.6)) AND ((MAXH10 = H1) OR (MAXH10 = H)) AND (C1 > O1) AND (C
< O1) AND (O > C1) AND ((2 * (C1 – O1)) < (O – C)) AND (AVGV10.1 > 250)


KISS With Stochastic Settings – TC2000 PCF’s – TradeOn.com

Stochastic Settings (namvet34) Use with K.I.S.S.I rely heavily on stochastic settings and although they aren’t 100% reliable, they are a good
indicator for me. I set my # 12 tab up like this and I never touch this one…never!

I use the bottom stochastic to alert me as to when a stock is beginning to move (the fast line breaks
up through the slower moving line. At this point the 3 day moving average
will be just about ready to cross the 5 day moving average on the top
chart. I then keep an eye one the middle stochastic chart. When the fast
moving line crosses the slow moving line the stock will already be in
an upward progressing. You won’t catch the beginning of a move but
you’ll have confirmation that the stock is moving up. Once I’m
in the stock I then begin to watch the bottom stochastic chart again.
When the fast line begins to cross down through the slower moving line
I’m getting ready to bail out. It’s not exact but its the
closest thing I can find that seems to work relatively well.

Let’t take this one step further. Right now I have my program open and the stock ASF is on
my screen. (I didn’t buy this one, it just happens to be on my screen
right now.) If you set you chart like I have mine, then I want you to
turn on your pointer and place it on 10/15/98, my signal point on bottom
stochastic. Notice the relative position on the price chart and how the
3 day is about to cross the 5 day. Next place your pointer on 10/21/98.
This is where I would enter. Now go back down to the bottom stochastic
and place your pointer on 10/31/98. This is the point where I consider
getting out since the upward move is breaking down. Its not a perfect
system but its the best I can come up with. I’ve put countless hours of
experimentation and testing into these settings. I hope you all play around
and try to refine them further. If so, be so kind as to share your results
with the rest of us. This isn’t foolproof either. When it works, it works
well. When it doesn’t, well, it just doesn’t. So be careful. Let me know what you think.


Blow Offs – TC2000 PCF’s – TradeOn.com

Blow Offs

Telechart 2000 User Group(jefwc)

Stochastic 7 K3 D5 EXP. MACD 12 26 9 EXP. Buy when Stochastic K
is rising from bottom. Buy more when it appears K will cross D, rising.
Buy more when K and D will cross MACD intraday near or above 0, both rising.
sell when Stochastic K looks sure to roll over intraday. go Short when
you’re certain it will rollover. It takes some practice so backcheck first
and watch volume.

Was referring to rising stoc xing MACD, linear plot xing per. 9. All
rise, converge at top of window. Bang!, blowoff, Sell out. Sell short
into market. Covered near close Tuesday. Makes perfect sense to me. Works
too.

Another example: ATHM 3-15 thru 4-13. Notice how stoc K bounced along
the still rising MACD? May be a dangerous game but do you want safety
or $.

Tab settings, more(jefwc)

Tab 1. 3 windows. Top window 1/2. Mid, Bot, 1/4 ea. Top, Price graph
open bar EXP, green. B bands 20-20. 50 day

SMA, 150 day EMA. Mid,TSV 18 day 9 day EMA.Bot, BOP. Tab 2 Top, same
configuration, 1/2 sceen. Mid 1/2 screen MACD 12-26-9, stoc 7-3-5. No Bot. Tab 3, Top configured, but pushed up out of sight.Mid TSV 22 day EXP, 10 day EMA. Bot, RSI 14 day 7 day EMA. Explained about CUST in Previous post. Will find and advise of post #.

Have had good luck with other stock using same tactics described in previous
post. Am working on grand project at present. writing new PCF’s assembling scans for all bottoms and tops. So far 1st attempt went 8 for 8. Beginners luck?

Used old DOS version 3 with success for a few years. New version 4 like
dying and going to heaven. When trending consolidating 25 days scan wouldn’t update simply deleted it. Who needs it? Can always re-write if desired.

Tab 4 Top, same configuration as usual, 1/2 screen. Mid, 21 day TSV 10
Day ROC, 1/2 screen. No Bot. Use several methods both long/short. There is a very special reason for 150 Day EMA in window 1. Monitor it and purpose becomes obvious immediately. It serves a second not so obvious purpose.
More later

jefwc(ejr39)

Are the following PCFs for your method correct?

Tab 1.

Top,

Price graph open bar EXP(?)

B bands 20-20

InSync BB

(C – (AVGC20 – (C * .01))) / ((AVGC20 + (C * .99)) – (AVGC20 – (C * .01)))

50 day SMA

(C > AVGC50)

150 day EMA.

(C > AVGC150)

Mid,

TSV 18 day

. . .9 day EMA.

InSyncTSV2 (modified)

(TSV18 > AVG(TSV18,9))

BOP

InSync’s BOP (modified)

(BOP > 30) AND (BOP > AVG(BOP,10))

Tab 2

Mid

MACD 12-26-9

InSyncMACD1 (modified)

(AVGC12 – AVGC26) > 0

stoc 7-3-5

(STOC7.3 > 80)

Tab 3

Mid

TSV 22 day EXP

. . .10 day EMA.

InSync TSV2 (modified)

(TSV22 > AVG(TSV22,10))

Bot

RSI 14 day

. . .7 day EMA

(RSI14 > AVG(RSI14,7))

Tab 4

Mid

TSV21

. . .ROC10

InSync TSV divergence (modified)

(TSV21 >= MAX(TSV21,10))

Let me know if this is correct?

Blow off in pictures(jefwc)


Canslim – TC2000 PCF’s – TradeOn.com


CANSLIM Components (sly_capt)According to Mr. O’Neil, CANSLIM is as follows:

C = Current quarterly earnings
A = Annual earnings increases
N = New Products
S = Supply and demand
L = Leadership / laggard
I = Institutional Sponsorship
M = Market direction

CANSLIM update(papajoeb)

C
– Current Quarterly earnings => 25% (5-7 qtrs)
A
– Annual Earnings => 25% (last 3 yrs)
N
– New Highs (new prod,new execs,new tech)
S
– Supply/Demand ( used to be cap , but because of big cap lead ,BON now
looks to shares outstanding,prefers 25-30M but any will do if other characteristics met
L
– Leader (top 20% IBD’s relative price strnght rating — i don’t know
if this is same/similar ? to the wilder RSI or not)
I
– institutional support -resume high volume, funds don’t buy in 10s they
buy in 100s (K)
M
– Market , general mkt criteria, analyze DOW S&P NASdaq, i don’t think
can be a PCF factor.

IBD hilites high volume spikes, maybe we start there, add strong RSI , put a couple
of earnings factors ???? and top it off with a new high criteria.

CANSLIM
summary on the net
(danu3)

Got this from Daily Graph product from IBD, that is why you see it keep on mentioning
Daily Graph.

CANSLIM
related sites
(TAN JOSEPH98)

Infomation:
stock ranking:

Tradeon Stock trading tips and tricks

us crash
index – interesting:

Canslim

O’Neil(Poppejans)

I wrote a
simple pcf
NEW
52 WEEK HIGH pcf is:
MAXC250 <= C

Almost everyday I run the easyscan

NEW 52 WEEK
HIGH ( you guessed it ) Tonite there are 77 hits. I scan these charts
using Tools | slide show. I flag those that look interesting. I have created
a bulleted watchlist appropriately called: New 52 week high ( you guys
are good) I add the flagged stocks to this list. You will notice that
you don’t have to do this everynight because stocks that make new highs
seem to continue doing so, some for a long time, so you will catch them
eventually. To name a few: SCH, GPS, PGTV, HRZ. Look at WCAP (4/5 there
is even a worden comment just before the big move started. I have set
up a daily chart zoom 5 with 13 day-EMA and 50day-EMA. These stocks will
pull back to the 13 day-EMA, sometimes even the 50 day-EMA. You can scan
this list using the SORT, making use of all your pcf’s and easyscans.
Look at ITVU 3/16 as a good example.


CANSLIM focus Stocks(ejr39)

PCFs Dahl(89)

((AVGC89 – AVGC89.27) > 0)

PerCent Volume

((V – AVGV63) / (AVGV63 + .001)) * 100

Relative Strength Value

(((C / (.001 + C62)) * .04) + ((C63 / (.001 + C125)) * .02) + ((C126 / (.001
+ C188)) * .02) + ((C189 / (.001 + C251)) *.02)) * 100


EasyScan

<Media General Fundamentals>

. . .( C ) = <EPS Percent change latest year> (Value) 18 to Max

. . .( A ) = <Earnings Growth Rate 5-Yr> (Value) 20 to Max

<Technicals>

. . .( N ) = <Price as Percent of 52 Week High – H> (Value) 80 to Max

. . .<Price per Share – H (Value) 12 to Max

<Media General>

. . .( S ) <Capitalization> adjust to your style

<Personal Criteria>

. . .( S ) = PerCent Volume (Value) 1 to Max

. . .( L ) = Relative Strength Value (Rank) 80 to 99

. . .( M ) = Dahl(89)

WatchList
to Scan: All Stocks

<Save>
Name <Scan>

Add or change any criteria to fit your investing style.

( I ) is a look up in IBD

Compare the daily list with IBD; adjust the PCFs and EasyScan criteria until you are
comfortable with the results. Keep in mind that this is a focus group
– you must perform the additional due diligence (DD).

CANSLIM(Sputnick55)

Now I dont use the volumepercent part.

What I am looking for is something I am still working on.. a lack of volume in a
strong stock and strong uptrend

I use my lack of volume pcf

(1)Volume
5<30
AVGV5
< AVGV30 AND AVGV5.20 < AVGV30.20

or

(2)Volume 5<30

AVGV5 < AVGV30

Im going to post more on what Im working on as soon as im happy with the results.
(so far so good) Ill post more as soon as I feel good about the results,
I dont like putting anything out that I wouldnt use.

The volume is only the starting point, im tring to work out is a macd scan on a faster
macd. (5/10/6), Im also working with a a lack of volume and a rising price
over a few days.. (hoping to catch the ‘pop’ to the magical 52 week high)

This is a work in progress I hope im on the right track

Canslim – revisited(ejr39)

Revised / Updated CANSLIM PCFs

From the Club’s website: 26 Weeks to Success. O’Neil expands on the CANSLIM selection
process.

Week06 Relative
Strength: A Key Technical Tool
Relative Strength PCF (Rate of Change)

(C / (C250 + .001))

Add the Relative Strength PCF to the weekly CANSLIM Easy Scan; remove the QP2 Relative
Strength Value PCF (It’s too restrictive).

Week08 The Importance of Volume, Sponsorship Volume % Change

((V – AVGV50) / 100)

Remove the PerCent Volume PCF (Incorrect results for CANSLIM strategy).

Accumulation/Distribution
(Acc-Dis)

AVG(BOP,65)

The IBD “Acc.-Dis.”
rank tracks the last 13 weeks (65 days) of trading volume.

Use an EasyScan
Range selector to DETERMINE the Accumulation/Distribution rate i.e.

An A or B rating means the stock is being bought;

. . .A rating
= Range selector (Rank) > 80

. . .B rating
= Range selector (Rank) > 60 AND < 80

A rating
C indicates a neutral setting

. . .C rating
= Range selector (Rank) > 40 AND < 60

A D or E
rating means the stock is being sold

. . .D rating
= Range selector (Rank) > 20 AND < 40

. . .E rating
= Range selector (Rank) < 20

Screen Tab#
Indicator settings

Middle

. . . Balance
of Power – check Visible

. . . . Moving
Average – 65 bars – Simple

Bottom

. . Volume
Bars

. . . Moving
Average – 50 bars – Simple

CANSLIM and volume scans(Sputnick55)

Ejr39

Once again
you have came to my aid. You are truly appreciated!

———–

PCF for buying
on low volume

(V < ( AVGV180.1 * .3))

(Stay away from thinly traded stocks when using this method).

Sputnick55, you might try a volume oscillator,

Volume trading secrets – you must know

————-

This seems to do the trick very well..(from the link) volume oscillator 5-30

((AVGV5-AVGV30)/(.001+AVGV5))*100

(place at 50% and below) couple this with your canslim profile and you do appear
to have some very good stocks to work with.. (looking for a “dryup of
volume” with stock moving slowly on low volume) I think the low volume
could work also on good stocks, over a 3-4week time frame.. (thats next)
Im still testing it, the other day was good. Ill see how it works on down
days etc. (I dont update the system on friday so I can test it over the
weekend, this came back with very good results.. only one day though)

Today sunday I scanned it and it came back with 35 stocks. (The ones in group ‘a’ are
: csco kron ossi kare krb roh ait sns bio-a) most are carryovers from
thursday I just put the scan in on friday. Waiting in group ‘b’ are (csco,
tlab ir trb vci nvh gcp (nvh should move to groupe a )

They seem to just roll in and you have to put up several “watch groups” and re-rank
them daily. The idea is that these stocks are designed to beheld for a
short time frame.

CANSLIM(ejr39)

The PCF for buying on low volume is the original formula for TC2000 version 3

(V < ( AVGV180.1 * .3))

The AVGV180 is 6 months; you might try using 6 trading months:

(V < ( AVGV126.1 * .3))

As before, YOU are on the right track. Building a strategy from the beginning keeps
YOU in control; there’s no second guessing as to what the author’s indicators
and oscillators are telling you – ’cause you are the author.

I’m delighted that you persisted in wanting to know more about CANSLIM EasyScans and
PCFs.

CANSLIM(Sputnick55)

I have been using the avgbops scans among others

50+rank

AVG(BOP,21)
&

AVG(BOP,65)

For dry-up in volume today

Bop Value today (67-30 value)

(wait for the next rush of volume to tell me the trend and have the orders in place
respectively, the 1 day bop is a trigger” day for me. sometimes you get
a few days but the stocks are on your hot-list and you have a clue to get
ready to watch the volume and press the shiney red button)

trend dahl

(AVGC34
– AVGC34.9) > 0

52week high

90-max

(skipping the eps etc)

I imported some data on stocks with low-mid floats run it through excel with average
volume of 100k etc. and at least 25% ownership by institutional


Added: 05-06-01
C A N S L I M

C
Current Quarterly Earning:
EASYSCAN:
EPS Percent change last year

18 to max (Value)

“Current quarterly earnings per share should be up a major percentage (at least 20% to 50% or more) over the same quarter last year. The best
ones might show earnings up 100% to 500%.” >=25% for the last 5-7qtrs
-How To Make Money In Stocks

A
Annual Earnings:
EASY SCAN:

Earnings Growth Rate 5-Yr

20 to max (value)

“The
annual compounded growth rate of earnings in the superior firms you hand pick for purchasing stock in should be from 25% to 50%, or even 100% or more, per year over the last 4 or 5 years.”
>= 25% for the last 4 to 5 years
-How To Make Money In Stocks

N
New Highs:
EASYSCAN:

Price as Percent of 52 Week High-H

80 to max (value)

EASYSCAN:

Price per share H

12 to max (value)

“Search for corporations that have a key new product or service, new management,
or changes in conditions in their industry. And most importantly, companies whose stocks are emerging from price consolidation patterns and are close to, or actually touching, NEW HIGHS in price are usually your best buy candidates.”
-How To Make Money In Stocks

S
Supply/Demand:
PCF:

CANSLIM Volume % Change
((V-AVGV50)/100)

85 to 99 (value)
EASYSCAN:

Capitalization

1 to 99 (value) or Adjust value to your style

“95% of the companies had fewer than 25 million shares in their capitalization when they had their greatest period of earnings improvements and
stock market performance. The average capitalization of top performing
listed stocks from 1970 through 1982 was 11.8 million shares. The median stock exhibited 4.6 million shares outstanding before advancing
rapidly in price.”
-How To Make Money In Stocks

L
Leadership:
PCF:

CANSLIM Relative Strength
(C/(C250+.001))
80 to 99 (value)

“The 500 best performing listed equities for each year from 1953 through 1993 averaged a relative price strength rating of 87 just beforetheir major increase in price actually began. So the determined winner’s rule is: Avoid laggard stocks and avoid sympathy movements. Look for the genuine leaders.” Relative Strength of 80 or higher.
-How To Make Money In Stocks

I
Institutional Sponsorship
Look up in Investors Business Daily and/or
PCF:

CANSLIM Accumulation / Distribution (Acc-Dis)
AVG(BOP,65)

>80 = A

>60 and <80 = B

>40 and <60 = C

>20 and <40 = D

<20 = E

“This tells you if your stock is under accumulation (professional buying) or distribution (professional selling). Pick only A or B ranked companies and avoid C, D and E ranked ones.”

The IBD acc-dis rank tracks the last 13 weeks (65days) of trading volume.

Use an easyscan rank selector to determine the acc/dis rate


“Buy stocks that have at least a few institutional sponsors with better than average recent performance records.”-How To Make Money In Stocks

M
Market Direction:
PCF:

CANSLIM Dahl (89)
((AVGC89-AVGC89.27)>0)

“Learn to interpret the daily general market indexes and action of the individual market leaders.”-How To Make Money In Stocks

S U M M A R Y
First create these 4 PCF s and then update all.
1 Name: Canslim Volume % ChangeFormula: ((V-AVGV50)/100)
2 Name: Canslim Relative StrengthFormula: (C/(C250+.001))
3 Name: Canslim Dahl (89)Formula: ((AVGC89-AVGC89.27)>0)
4 Name: Canslim Acc/DisFormula: AVG(BOP,65)

Next create this easy scan: This scan does not produce many stocks,
most of the time less than 7.

The next easy scan screen is what I normally use every day and it produces between 10 & 20 stocks.


How to Make Money in Stocks: A Winning System in Good Times or BadWhether trading $500 or $50,000 — O’Neil’s CANSLIM system gives you a sound, proven framework for picking winners and by-passing losers. You’ll learn: -When to buy undervalued stocks – When to sell -Reduce risk -Use the financial pages to spot winners Get this winning system on your side! Get Yours for $5.00


VB Extension relationship to Telechart 2000 – TC2000 PCF’s – TradeOn.com

VB Extension relationship to Telechart 2000
This program is written in Visual Basic 6 and uses standard extensions provided by Worden brothers. It utilizes a module called TC2000Dev.exe which must be supplied from your install CD. This program while written in Visual Basic does not require the user to have Visual Basic Installed on his/her PC.

Disclaimer
In no way should the use of this program be construed as financial or investment advice and the author assumes no responsibility at all for problems or support of this program. Use at your own risk.

VB Requirements/Restrictions

You do not need to have Visual Basic installed on your computer. You will need to be running a 32 bit operating system, Windows, 95, 98 or NT.

The program does not allow resizing of the screen at the present time.

At present, most display of stock data will be skipped if there is not approximately 180 days of history.

Install 1) Download the Not Available, was named: InsynIns.ZIP file into an empty directory.

2) Unzip the file using “WinZip” available on the web if you don’t have it.

3) You should now have 3 new files in the directory. “Insync.CAB”, “setup.exe”, and “Setup.1st”. Double click on “setup.exe” and the program will install.

4) When running the program press the “F1” key for help. 5) To properly view this program your monitor should be set for a screen resolution of 1024 X 768.

The yellow graph is the insync index.

InSync Index – TC2000 PCF’s – TradeOn.com


InSync Index

InSync Index
(ejr39)

For those who aren’t familiar with the InSync Index (II): “…the Insync Index shows
that when a majority of indicators are IN SYNC – a turning point is near.
By using the index as a filter, large databases can be scanned quickly
to identify issues that may be about ready to reverse their TREND.” (From
SI’s Technical Analysis for Beginners)

This is the InSync Index adapted for TC2000 version 4.2.0040 . . .DPO, EMV, MACD,
ROC, RSI, and Stochastics are time tested; these PCFs are ‘chiseled
in stone’ – adjust the Sort Ranks and Values using the EasyScan Range selectors.

. . .Change BOP and TSV values to compliment both the established II components and
your trading/investing style.

This II tally starts with 75 points; add or subtract points as indicated. II is oversold
if the tally is less than 30 points (20%); II is overbought if the tally is greater than 135 points (90%).

*** *** ***
*** ***

*** *** ***
*** ***

INSYNC INDEX

*** *** ***
*** ***

*** *** ***
*** ***

Bollinger Bands

11 InSBB:
(C-(AVGC20-(C*.05)))/((AVGC20+(C*.95))-(AVGC20-(C*.05)))

. . .If the (Upper) InSBB Sort Value is greater than > 0, add 5 points.

. . .If the (Lower) InSBB Sort Value is less than 0, subtract 5 points.

Bollinger Bands


See, also:

. .TeleChart 2000 Help Topics

** ** ** **

Moving Average Convergence Divergence (MACD)

17 InSMACD1:
(AVGC8 – AVGC17)

17 InSMACD2:
(AVGC8 – AVGC17) – (AVG(AVGC8,10) – AVG(AVGC17,10))

. . .If InSMACD1
Sort Value is greater than 0 AND InSMACD2 Sort Value is greater than 0,
add 5 points.

. . .If InSMACD2
Sort Value is less than 0 AND InSMACD2 Sort Value is less than 0, subtract
5 points.

See, also:

. .TeleChart
2000 Help Topics

** ** ** **

Price Rate
of Change (ROC)

15 InSROC:
(C/C10)

. . .If InSROC
Sort Value is greater than 1 AND (visual confirmation) ROC(10) is greater
than a simple 10 dma applied to ROC(10), add 5 points.

. . .If InSROC
Sort Value is less than 1 AND (visual confirmation) ROC(10) is less than
a simple 10 dma applied to

ROC(10), subtract
5 points.

See, also:

. .TeleChart
2000 Help Topics

** ** ** **

Stochastics

13 InSSt:
(Stoc14.1)

. . .If InSSt
Sort Value is greater than 80, add 10 points

. . .If InSSt
Sort Value is less than 20, subtract 10 points

Edit chart’s
Indicator Tab#

. .<Add
Indicator>

. .Stochastics

. . .Period
14, %K 1, %D 3

. . .message
4495 (3 line stochastics)

See, also:

. .TeleChart
2000 Help Topics

** ** ** **

Wilder’s Relative
Strength Index (RSI)

12 InSRSI:
(RSI14)

. . .If InSRSI
is greater than 70, add 5 points

. . .If InSRSI
is less than 30, subtract 5 points

See, also:

. .TeleChart
2000 Help Topics

** ** ** **

TC2000’s BOP,
CSM, and TSV are substituted for CCI and MFI.

** ** ** **

Balance of
Power (BOP)

18 InSBOP1

(BOP1)

** or Select
<BOP Value Today-H> from the Main Screen WatchList’s Select
Criteria to Sort by dropdown menu **

18 InSBOP2

BOP > AVG(BOP,10)

. . .If InSBOP1
Sort Value is greater than 0 AND InSBOP2 Sort Value is TRUE, add 5 points.

. . .If InSBOP1
Sort Value is less than 0 AND InSBOP2 Sort Value is blank, subtract 5
points.

. .Special
Reports: Interpreting Balance of Power (Parts One and Two)

See, also:

. .TeleChart
2000 Help Topics

. .Users Guide
p. 59, p. 61-64

. .Daily Worden
Report for 8/16/98

** ** ** **

Cumulative
Money Stream (CMS)

Visual

CMS has two parts.

Part 1: See
message 4333, Divergence (Replace Time Segmented Volume indicator with
Money Stream indicator)

. . .Positive
divergence, add 5 points.

. . .Negative
divergence, subtract 5 points.

Part 2:

. . .If today’s
CMS is greater than a simple 40 dma applied to CMS, add 5 points.

. . .If today’s
CMS is less than a simple 40 dma applied to CMS, subtract 5 points.

See, also:

. .TeleChart
2000 Help Topics

. .Users Guide
p. 60-64

** ** ** **

Time Segmented
Volume (TSV)

19 InSTSV1

(TSV18)

19 InSTSV2

(TSV18 >
AVG(TSV18,10))

19 InSTSV3

(AVG(TSV18,10))

TSV has 4
parts:

Part 1:

. . .If InSTSV1
Sort Value is greater than 0, add 5 points.

. . .If InSTSV1
Sort Value is less than 0, subtract 5 points.

Part 2:

. . .If InSTSV2
Sort Value is TRUE, add 5 points.

. . .If InSTSV2
Sort Value is blank, subtract 5 points.

Part 3:

. . .If InSTSV3
Sort Value is greater than 0, add 5 points.

. . .If InSTSV3
Sort Value is less than 0, subtract 5 points.

Part 4 – visual
(See message 4333, Divergence)

. . .Positive
divergence, add 5 points.

. . .Negative
divergence, subtract 5 points.

. .Special
Reports: Interpreting Time Segmented Volume (Parts One and Two)

. .message
4333 (Divergence)

See, also:

. .TeleChart
2000 Help Topics

Confirmation
PCFs

. . .TC2000
version 4.2.0040 allows calculation of DPO and EMV; unfortunately, the results are values only. Tally the DPO and EMV points as indicated. (I’ve found these indicators helpful when choosing between several TENDING stocks
with similar tallies.)

** ** ** **

Detrended Price Oscillator (DPO)

16 InSDPO:
(C-((AVGC18/2)+1)

. . .If InSDPO
Sort Value is greater than 0, add 5 points.

. . .If InSDPO
Sort Value is less than 0, subtract 5 points.

** ** ** **

Ease of Movement Value (EMV)

14 MidPoint
Move

InSEMV1:
((H + L) / 2) – ((H1 + L2) / 2)

14 Box Ratio

InSEMV2: (V
/ (((H * 8) – (L * 8)) + 0.001)) * .01

…If Insemv1
> 0 and Insemv2 > .5, add 5 pts

…If Insemv1
<0 and Insemv2 < -.5 add 5 pts.

14 InSyncEMV

. . .Combine in an Easy Scan for the TC2000 InSync Index

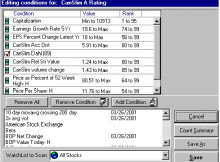
For Overbought condition:

. . . . .Adjust
InSEMV1 Range Selector Value)…0 to Max

. . . . .Adjust
InSEMV2 Range Selector (Value)…5 to Max

For Oversold condition:

. . . . .Adjust
InSEMV1 Range Selector (Value)…Min to 0

. . . . .Adjust InSEMV2 Range Selector (Value)…5 to Max

Note:

*Sort Value appears on the Main Chart window below the WatchList and Sort windows
– below the Ascending /

Descending buttons – in the [Symbol [ Company Name ] Sort Value] window

Please remember that the TC2000 InSync values are suggestions. As you understand each
indicator or oscillator, adjust the values to suit your investing / trading style.

** ** ** **

** ** ** **

Notes:

Comment on InSync from Richard Evans:

“INSYNC is one that I always look at on CANSLIM stocks for reentry and exit. A
move up thru 20 is a buy; a move down thru 90 is a sell then a move back
up thru 50 is a buy with down move thru 90 your sell. The move from 90
to 40-45 are resting spots for reentry. (20 and 90 are good trigger lines
with 50 for reentry).”

*** If you
wish to use Richard Evans suggestions with the TC2000 version 4.2.0040
InSync Index Tally, adjust to: A move up thru 30 is a buy; a move down
thru 135 is a sell then a move back up thru 75 is a buy with down move
thru 135 your sell. The move from 135 to 60-67 are resting spots for entry.
(30 and 135 are good trigger lines with 75 for reentry.) ***

** ** ** **

CSM can be substituted for OBV in DNS.

** ** ** **

CCI can be duplicated visually in TC2000 by setting Bollinger Bands for a period
21 days, 15 width (1.5 std dev).

InSync
Index for TC2000 in Words(ejr39)

InSync Index for TC2000 in words:

InSBB

Today’s price vs. simple 20-day ma Sort Value*

InSRSI14

Today’s raw RSI14 Sort Value*

InSSt14.1

Today’s raw 14 Period Stochastics Sort Value*

InSyncEMV

Today’s Box Ratio Sort Value*

Today’s EMV
Sort Value*

. . .Combine in an Easy Scan for the TC2000 InSync Index

InSROC

Today’s ROC(10)
Sort Value*

InSDPO(18)

Today’s DPO(18)
Sort Value*

InSBOP

Today’s BOP
Sort Value*

Today’s BOP is greater than its simple 10-day ma (Sort Value* True)

InSTSV

Today’s TSV18 Sort Value*

Today’s TSV18 is greater than its simple 10-day ma (Sort Value* True)

Today’s TSV18’s simple 10-day ma Sort Value*

InSMACD

Today’s MACD8.17
Sort Value*

Today’s MACD8.17’s
simple 10-day ma Sort Value*

Notes:

*Sort Value appears on the Main Chart window below the WatchList and Sort windows
– below the Ascending /

Descending buttons – in the [Symbol [ Company Name ] Sort Value] window

In the original InSync Index,

. . .EMV is compared to its simple 10-day ma

. . .DPO is compared to its simple 10-day ma

TSV . . .Worden Brother’s suggest 18, 26, or 34; use the one that fits your style

InSync
Index Chart Layouts(ejr39)

Chart windows for InSync Index PCF’s.

To charts from the Edit Indicator window: <Add Indicator>

. . .Bollinger Bands to the price in a top window

. . . .Period
20

. . . .Width 20

. . .Moving
Average to the price

. . . .Period 20

. . .Wilder’s RSI (in another window)

. . . .Period 14

. . . .Avg
Period 1

. . .Stochastics

. . .(If you understand the concepts of RSI and Stochastics, use the same window, otherwise
use another window).

. . . .Period 14

. . . .SK
Period 1

. . . .SD
Period 3

. . .Volume
Bars (in another window)

. . . .Moving
Average

. . . . .Period 120

. . .BOP (in
another window)

. . . .Moving Average

. . . . .Period 10

. . . . .Simple

. . .TSV(in
another window)

. . . .Period 18

. . . .Moving Average

. . . . .Period 10

. . . . .Simple

. . .Follow instructions for divergence in message 4333.

. . .OBV (or
CMS) (in another window)

. . . .Moving
Average

. . . . .Period
40

. . .MACD
(in another window)

. . . .Short
8

. . . .Long
17

. . . .Period
9

. . . .Exponential

. . . .Moving
Average

. . . . .Period
10

. . . . .
. .Simple

Note: If you understand the concepts, the indicators and oscillators can be combined
into any cominations that you prefer.

Suggestion: Display Moving Averages on the indicators and oscillators as Drawing Color
white, Drawing Style dotted.


KISS Formula – TC2000 PCF’s – TradeOn.com

K.I.S.S. Formula

13% return in 6 days (Carpe9Diem)

Ok everyone here it is. I started using this formula Dec 16, 1998 and it has had a 13% return. It is based on Namvet34 stochastic settings posted in message 273. USE THOSE SETTINGS WITH THIS FORMULA, THEY WORK!! This is more of a short term formula . I don’t hold stocks much more than a week. In fact in the 6 days I have tested this I have bought and sold 5 stocks. I am still holding 2 of the 5. The list of stocks that generated by the formula change every day so if you find one you that you like put it in a watch list because it will most likely be gone the next day. Also, view the stocks by Price Per Share, it makes the list more manageable. Here is the stock I bought today: JRC it went up 1.25$. This is a simple formula , I created it using the K.I.S.S theory, Keep It Simple Stupid!! I thank my dad for that. Also for those people that dont think 13% is alot consider this, if you continued to make 13% of your total balance every 6 days for a entire year on a 10,000$ investment you would end up with over a million (thats 1,000,000 )by the end of the year. That averages out to about 2% gain per day on total balance for the 250 trading days. I checked the math twice, it is right. choose you stocks carefully. Take the time to research and learn how to read the charts and you will be a profitable investor. Here it is:
K.I.S.S. objective(Carpe9Diem)

My objective when using this formula is to find stocks in a short term rally… here are some examples of stocks that have been in short term rallys since dec 16.. THOR, VARL, JRC, RTWI, PHYC, DSTM, HDIE.. All of which came from the KISS FORMULA and all of them great short term money makers.. Hope this helps!!

Original K.I.S.S. formula:(Carpe9Diem)

V >= V1*1.5 AND TSV1 > TSV1.2 AND STOC8.4 > STOC8.4.2 AND STOC26.9
>STOC26.9.2 AND AVGC3 > AVGC3.2

Another K.I.S.S. formula:

STOC12.5
TSV1 > TSV1.2 AND STOC8.4 >STOC8.4.2 AND STOC26.9 > STOC26.9.2
AND AVGC3 > AVGC3.2 AND V >= (1.5 *AVGV42.1) AND (AVGV42.1) >
1000 AND C < 25

Stochastic Settings: (namvet34)

Use these settings with K.I.S.S. I rely heavily on stochastic settings and although they aren’t 100% reliable, they are a good indicator for me. I set my # 12 tab up like this and I never touch this one…never! On the top chart, I set up 2 moving averages. I use a 3 and a 5 day moving average because I want to know what’s happening NOW! My middle chart setting is a stochastic chart with the following settings: 26-9-12 simple. My bottom is also a stochastic with these settings: 8-4-6 exponential. I use the bottom stochastic to alert me as to when a stock is beginning to move (the fast line breaks up through the slower moving line. At this point the 3 day moving average will be just about ready to cross the 5 day moving average on the top chart. I then keep an eye one the middle stochastic chart. When the fast moving line crosses the slow moving line the stock will already be in an upward progressing. You won’t catch the beginning of a move but you’ll have confirmation that the stock is moving up. Once I’m in the stock I then begin to watch the bottom stochastic chart again. When the fast line begins to cross down through the slower moving line I’m getting ready to bail out. It’s not exact but its the closest thing I can find that seems to work relatively well. Let’t take this one step further. Right now I have my program open and the stock ASF is on my screen. (I didn’t buy this one, it just happens to bo on my screen right now.) If you set you chart like I have mine, then I want you to turn on your pointer and place it on 10/15/98, my signal point on bottom stochastic. Notice the relative position on the price chart and how the 3 day is about to cross the 5 day. Next place your pointer on 10/21/98. This is where I would enter. Now go back down to the bottom stochastic and place your pointer on 10/31/98. This is the point where I consider getting out since the upward move is breaking down. Its not a perfect system but its the best I can come up with. I’ve put countless hours of experimentation and testing into these settings. I hope you all play around and try to refine them further. If so, be so kind as to share your results with the rest of us. This isn’t foolproof either. When it works, it works well. When it doesn’t, well, it just doesn’t. So be careful. Let me know what you think.

To Everyone:(Carpe9Diem)

For those people using the formula I posted, DON’T pick a stock just to be picking one. It is possible for the list to generate no good stocks to buy.If you are not totally confident with what you see or there is a hint of doubt don’t buy .You can not lose that way and there will always be others to buy tomorrow. Remember you will never go broke by taking profits!!! Before I make a trade I ask myself how am I willing to risk to make a profit. If the risk is good then I make it if there is even a hint of doubt I don’t. I never ask myself how much money am I going to make by making this trade. If you do that you will lose more times than not, I have seen too many people, myself included, hold too long and lose the profit they had trying to get that extra 1/8 of a point or when the stock starts to drop they hold on to it not wanting to take a loss thinking it will go back up. But it does not. You are going to lose some of the time. If it looks bad get out and take a small loss compared to a huge loss later. The best traders in the world are successful only 75 to 90% of the time. Like the old song goes “know when to hold them, know when to fold them”. This philosophy has saved my neck more than once!!

Working with K.I.S.S. (anthonymdavis)

I have taken the KISS formula and added it into a scan along with some other stuff to limit the number of stocks to view. Sure I limit myself from ALL the stocks available but then, who has the time to check out 880 stocks at a time?

This is what I have done: I made a personal criteria called “increasing Volume for 3 days” (Somebody else’s idea here earlier.)

V>V3

This is what I use to sort the scan. Then, I took the KISS formula and put into another Personal Criteria called “Keep it simple”

Finally, I made an easy scan called “Simple Scan”. This includes the Keep it Simple (KISS formula),

Earnings % of sales for 1 yr = 50-99 (rank)

EPS change for 1 yr = 50-99 (rank)

RSI Today = 75-99 (rank)

BOP = 75-99 (rank)

I know this is no great discovery as I have used alot of other’s ideas but this cuts down the scan from 800 down to about 28. You may want to do different but this works for me (for now).

Reducing KISS Numbers: (JIM_P64)

I tried a scan using KISS alone tonight and came up with 517 stocks instead of he 1700 you got. I have no idea what is causing the discrepancy. The scan I am currently using (they seem to change every day as I learn more on this site)has stochastics, price/share, volatility, and volume filters. I ended up with 18 stocks in my scan tonight. If you’re interested in trying what I have, I’ll give you the details. Besides the KISS formula as one personal criteria, I use a stochastics criteria


Those two together reduced my number of stocks to 67. I then used :

PRICE/SHARE (30 TO 97 RANK), VOLATILITY (15 TO 99 RANK), and VOLUME 5 DAY (40 TO 95 RANK).

These last three filters reduced my number of stocks to 18.

Give it a try and see if you come up with anything interesting. Im not aware of any way to backtest using TC2000. I have Omnitrader for back testing, but I don’t use it very much because I find it confusing. You can get buy signals and sell signals on the same stock, depending on which parameters you use. jim

Variation:(Carpe9Diem)

I added a slight variation that is not in post 647 here is the new formula it gives you a little better list and gets rid of stocks with volume less than 15,000…and the 150 is right that is how the program reads volume.

V >= V1 AND TSV1 > TSV1.2 AND STOC8.4 > STOC8.4.2 AND STOC26.9
>STOC26.9.2 AND AVGC3 > AVGC3.2 AND V >= 150

K.I.S.S. suggestion:(ejr39)

In the updated KISS formula (message 1060), a daily volume of 15,000 is a thinly traded stock. For more liquid stocks, trade stocks with a daily volume > 100,000 shares. Rather than limit volume in the KISS (Personal Criteria) formula, create an Easy Scan that includes the KISS formula.

From Easy Scan’s Technical Library add:

volume 1-day
– H (value) 1000(00) to max

volume 5-day
– H (value) 5000(00) to max

volume 90
day (rank) 75 to max

The volume criteria insures liquidity (supply/demand). The bid/ask spread is usually less for a liquid stock. (If you like, add Optionable Stocks from Easy Scan’s General Library to remove lower priced stocks and IPO’s)

K.I.S.S. suggestion: (ejr39)

Use the volume formulas from the Gary B Smith tactics (message 1004), Smith is looking for the volume “pop” that precedes a major price movement.

My variation on the KISS formula:

TSV1
> TSV1.2 AND STOC8.4 > STOC8.4.2 AND STOC26.9 > STOC26.9.2 AND
AVGC3>AVGC3.2 AND V >= (1.5 * AVGV42.1) AND (AVGV42.1) >= 1000

Try it you’ll like it – reduces the manual review process.

K.I.S.S. suggestion: (Horsthh)

EASY SCAN:

C > 8

KISS*

RSI today
= 80 to 99(rank)

BOP value
today-H = 80 to 99(rank)

Volume(Dollars)
1 day high = 80-99(rank)

*Personal Criteria Formula: KISS

STOC12.5
TSV1 > TSV1.2 AND STOC8.4 > STOC8.4.2 AND STOC26.9 > STOC26.9.2AND
AVGC3 > AVGC3.2 AND V >= (1.5 * AVGV42.1) AND (AVGV42.1) > 1000
AND C >25

K.I.S.S. suggestion: (Horsthh)

EASY SCAN:

C > 8

KISS*

RSI today
= 80 to 99(rank)

BOP value
today-H = 80 to 99(rank)

Volume(Dollars)
1 day high = 80-99(rank)

*Personal Criteria Formula: KISS

STOC12.5
TSV1 > TSV1.2 AND STOC8.4 > STOC8.4.2 AND STOC26.9 > STOC26.9.2
AND AVGC3 >AVGC3.2 AND V >= (1.5 * AVGV42.1) AND (AVGV42.1) >
1000 AND C > 25

K.I.S.S.(robkipp)

I entered your KISS scan and it looks good. I added BOP>30. Will ‘tweek’ it some more, but it does offers some nice picks
to look at

KISS 2.8 Beta (Carpe9Diem)

Been along time since I posted. Its good to still see some familiar Names. EJR39, babynuke, cprastch, poppejans. Been testing a formula since march and I am pleased with the results! Started testing on march 5 and have not had a losing watchlist yet!(% wise) Oldest watchlist I have is from March 5 has a current % gain of 11.65% with a high of 24.04% with 80 gainers and 74 losers(current) and 111 gainers and 43 losers(at its peak).(this is my best watchlist for a % high, although several have come close.) The worst watchlist I had was at its peak only had a 5.82% gain and is currently at 3.13%. Considering what the Markets have been through as of late thats not to shabby. This is my beta formula. I am currently testing one that has produced better results but want to test it for a another month or so before posting to make sure that it is up to spec. Hoping someone can add something to it to make it better. For those were not around for the original KISS formula, (it was posted in the pre 1000 area) KISS stands for: Keep It Simple Stupid! The more complicated you make it the more things that can go wrong!!

Note: all watchlists were held at least 15 days before results were recorded. This gives time for the stocks to run there course and filters out the occasional bad weeks. One more thing. Only tested this on NASDAQ stocks. Why?? I prefer to trade them.

KISS 2.8 Beta

(STOC26.9
+ STOC26.9.1 + STOC26.9.2) / 3 > 60 AND C > ( C15 * 1.1)AND (V1
+ V2 + V3 + V4 + V5) / 5 >800

KISS 2.8 (babynuke)

Hugh,
Had the same problem. Split off the volume from the pcf and this gave me 784 from all
stocks. Wrote the volume as a separate pcf but got zero. Rewrote the pcf as AVGV5. Created EasyScan with first half of formula, NASDAQ only stock, and AVGV5 pcf…set range selector to Value and got as close to 800 as
possible (819.2). This gave me 223
stocks. The 3 examples Carpe9diem gave all tested true with the complete pcf as posted. I just updated to the .0050 version.

The system seems to prefer individual formulas for pcfs and then combining them in EasyScans instead of using the AND operator in the pcf.

Ty